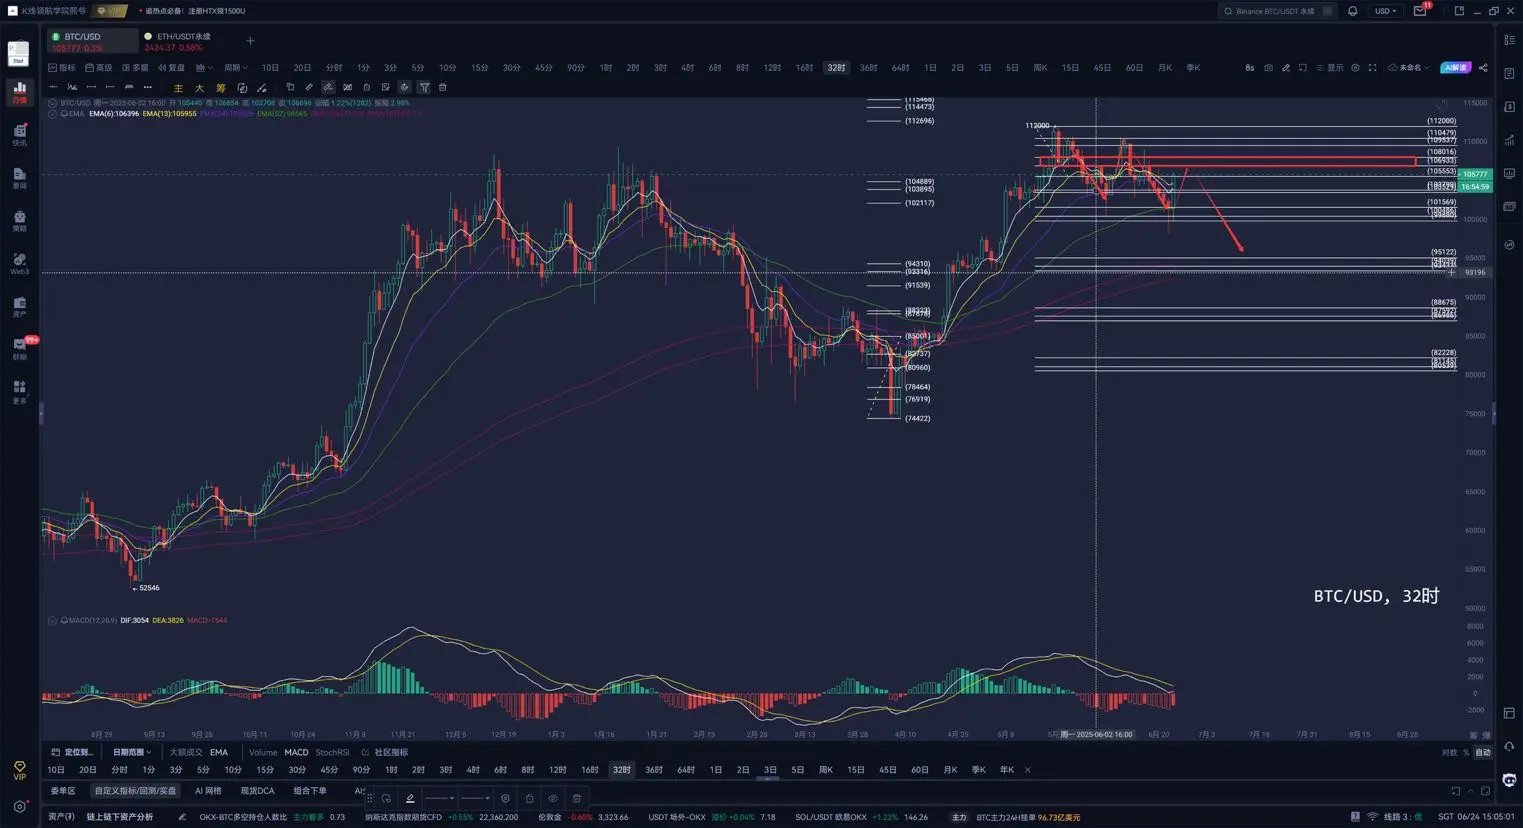
K-lineNavigationAcadem

vip

With ten years of experience as a senior analyst and trader in the crypto world, Candlestick charts are our opportunity for ordinary people to turn their fortunes around. Mastering the principles of Candlestick charts allows us to sustain our investments; learn to be an investor in Candlestick charts. I specialize in chart structure analysis, EMA moving average systems, and MACD technical indicator applications. In the field of analysis, it's important to listen less to theory and focus more on practical experience—that is the truth. You must believe in the value that technology brings you! The subscription dynamic plan is a one-stop solution: building a trend cycle investment trading system + identifying the bottom change in market trend logic for Spot layout + constructing a nested arbitrage system based on large cycle time logic + daily market data analysis! Welcome to visit and join us!

With ten years of experience as a senior analyst and trader in the crypto world, Candlestick charts are our opportunity for ordinary people to turn their fortunes around. Mastering the principles of Candlestick charts allows us to sustain our investments; learn to be an investor in Candlestick charts. I specialize in chart structure analysis, EMA moving average systems, and MACD technical indicator applications. In the field of analysis, it's important to listen less to theory and focus more on practical experience—that is the truth. You must believe in the value that technology brings you! The subscription dynamic plan is a one-stop solution: building a trend cycle investment trading system + identifying the bottom change in market trend logic for Spot layout + constructing a nested arbitrage system based on large cycle time logic + daily market data analysis! Welcome to visit and join us!

Trading Bots
Block This User
Pin
K-lineNavigationAcadem
vip
Buy MKR conditionally, medium to long term layout, buy and don't move, just wait to reap the rewards!
View Original
  • Reward
  • 5
  • Share
GateUser-3961885avip:
I have already turned bearish, why should I still layout altcoin medium to long term?
View More
K-lineNavigationAcadem
vip
The Bitcoin eight-hour level is experiencing a wide range of fluctuations in a downward trend channel. The first top purple area is the current important resistance level, while the green area serves as the defensive pressure.
The triangular area in the channel converges to choose a direction, but it needs to break below the position of 105413 first, with the bottom looking at the edge of the channel line. If it breaks, just look at the purple area.
Today, we need to pay attention to 107029, which is the intraday resistance level.
The above opinions are for reference only and do not constitute
View Original
post-image
  • Reward
  • Comment
  • Share
K-lineNavigationAcadem
vip
The two yellow top rectangles at the two-hour level for Bitcoin are important resistance levels.
The current level of bulls reaching a new high of 107500 is particularly critical. If this position continues, it will touch the second yellow position marked by my arrow.
The arrow marks the position as an important resistance level, and I have marked two short signals at this position.
The previous low point of 98200 only achieved the tp2 target, and there are still tp3 and tp4 at the bottom.
The main short signal has completed, and we can see that the position of the bottom yellow box is 93700 U
View Original
post-image
  • Reward
  • Comment
  • Share
K-lineNavigationAcadem
vip
Bitcoin 15-minute market conditions were discussed at this position last night, which corresponds to the completed current level tp4 segment.
108500 is unbreakable, this stage of the market has ended at the current level, and there is divergence at the current level.
One hour and two hours are strong adjustments. Once this adjustment weakens, it will definitely lead to a river of blood.
The short-term cycles give you a very strong market sentiment, but on a larger scale, as long as it does not break above 110,000 USD, you should maintain a bearish mindset.
The above views are for reference onl
View Original
post-image
  • Reward
  • Comment
  • Share
K-lineNavigationAcadem
vip
BTC15daily Candlestick and 20daily Candlestick double top line, Candlestick formation is difficult to break through $110,000, so we must be cautious at the moment.
The Elliott five-wave structure is very standard, while also forming a divergence double top, so from a static analysis perspective, the current level can be seen as a v-shaped reversal of the bearish trend at the current level.
After the structure is established, it is necessary to defend the head and shoulders structure. For the big cake, the formation of the head and shoulders means that the subsequent market is a big bear market
View Original
post-image
  • Reward
  • 2
  • Share
GateUser-465ab384vip:
In fact, looking at the short cycle, the followers rise quickly😂
View More
K-lineNavigationAcadem
vip
BTC 12-hour structural market analysis:
Pay close attention to the important resistance level 108060 in the purple rectangle, be cautious about the downward 📉 wide range trend channel.
High points do not continue to look for a pullback, still focusing on the weekend's low points, harmonic patterns bearish currently completed the first take-profit level, next position near $88777.
But there is still support at the current level of 95200, which is also the TP2 target at the current level.
In the entire major trend, if the double top is effective, the subsequent market will be very weak. Only fr
View Original
post-image
  • Reward
  • Comment
  • Share
K-lineNavigationAcadem
vip
BTC 15-minute chart:
The chart structure forms a wedge convergence, with a strong adjustment structure, currently depending on the direction given by the 30-minute timeframe.
Pressure mentioned defending 106500 yesterday in the short term, without continuing this high point, still looking for a pullback.
Support at the bottom defense rectangle position, provided that it needs to break below $104,700.
In the big trend, the 15-day moving average is still the most critical. The hammer hanging line is no longer continuing. The breakthrough of the short term cannot form effectively, so all rebounds
View Original
post-image
  • Reward
  • Comment
  • Share
K-lineNavigationAcadem
vip
Bitcoin 32-hour market analysis, I talked about the importance of the current level support during the weekend live broadcast.
However, there are important requirements for this rebound; it must be strong and powerful; otherwise, it can be regarded as an invalid rebound.
The red rectangle at 108,000 is quite important for the current level; without breaking through this position, the market still needs to look down at 95,200 USD.
If the pressure at the red rectangle position is broken, then the only short position at the top is between 109537-110479 US dollars.
Short-term oversold rebound, lon
View Original
post-image
  • Reward
  • Comment
  • Share
K-lineNavigationAcadem
vip
The last line of defense for Bitcoin must be closely monitored on the market data! Please pay attention to the importance of $96,000 - $99,150! #财经# #比特币btc# #ETH# #币圈# #BTC#
View Original
  • Reward
  • Comment
  • Share
K-lineNavigationAcadem
vip
Bitcoin大v天龙, the on-chain capital increase on Sunday, but is this pump a rebound or a reversal?
Still the same thing, if the rebound cannot be sustained, then all rebounds are invalid, because a deeper adjustment is needed at a larger level!
View Original
post-image
  • Reward
  • Comment
  • Share
K-lineNavigationAcadem
vip
The four-hour chart of Bitcoin shows that even if the market wants to fall, it won't be that smooth; it requires some time.
The structural direction is clear at a glance, so one can only wait with time. The important resistance level on the four-hour cycle is 103,758 USD, so pay more attention to it. The support still focuses on the area around 98,000.
The above views are for reference only and do not constitute any investment advice!
View Original
post-image
  • Reward
  • Comment
  • Share
K-lineNavigationAcadem
vip
BTC 6-Hour Market Analysis:
The current structure confirms a breakout from the triangular area, and the technical pattern indicates that the market price action will reach around 94900-96200.
And the yellow rectangle position serves as defense, a perfect double top structure. Please remember that all current rebounds are to prepare for the next step.
View Original
post-image
  • Reward
  • Comment
  • Share
K-lineNavigationAcadem
vip
Let's talk about the current Bitcoin market. The rise📈 in the weekly chart is extremely crucial in the overall trend. At the same time, there is a divergence at the current level, but market trends often occur during divergences. If the high point at the weekly level does not continue, then this rise📈 at the weekly level will be completely over.
The key point is the daily level of 103000, which is particularly critical, as well as the two-day line at 103473 USD. Once this level breaks, whether it is contracts or spot, one must choose to realize profits. If the above two positions do not hold
View Original
  • Reward
  • Comment
  • Share
K-lineNavigationAcadem
vip
Bitcoin please pay attention to the importance of 103,000 USD, this position cannot be ignored! #财经# #比特币btc# #ETH# #币圈#
View Original
  • Reward
  • Comment
  • Share
K-lineNavigationAcadem
vip
Bitcoin is consolidating in a triangular range for one hour, and it will take some time to choose a direction. The market is fluctuating in a narrow range, waiting to select a direction!
View Original
post-image
  • Reward
  • Comment
  • Share
K-lineNavigationAcadem
vip
BTC 4-hour market analysis:
The triangle pattern is broken, the pressure is 105800, and you can't close the current level to see the position of the red horizontal line!
The wedge expansion focuses on the bottom red trend line, provided that the triangular zone is valid!
#币圈# #比特币btc#
View Original
post-image
  • Reward
  • Comment
  • Share
K-lineNavigationAcadem
vip
The market is shaking intensely, but can the short-term period withstand the huge waves? From the current level, it feels like licking blood on the edge of a knife!
View Original
post-image
  • Reward
  • Comment
  • Share
K-lineNavigationAcadem
vip
The BTC daily chart structure looks very similar, it still needs some time, once the horizontal level breaks, it will be your moment to cheer! #比特币btc# #比特币超话#
View Original
post-image
  • Reward
  • Comment
  • Share
K-lineNavigationAcadem
vip
BTC one hour level:
Pay close attention to whether a pullback can form here at 105714 USD. Once the pullback is formed, the current level can see a double exploration market! #比特币超话# #财经#
View Original
post-image
  • Reward
  • Comment
  • Share
K-lineNavigationAcadem
vip
Please note the 30-minute resistance level of Bitcoin at 1053338; if it doesn't break here, shorting is advised, targeting yesterday's lowest point, with a defense for a second test! #Gate Alpha上新#
View Original
[The user has shared his/her trading data. Go to the App to view more.]
  • Reward
  • Comment
  • Share
K-lineNavigationAcadem
vip
I can clearly tell all investors in this field that the current trend of BTC is not very optimistic.
The current price action is very similar to the bull market in 2020, both in terms of indicators and patterns, as well as the logic of K's movement.
If the current high point of 112,000 USD is confirmed as the peak of this surge 📈, then I hope everyone will be cautious. Once there is an adjustment at the 15-day moving average level, there will be some panic for those who bought the dip at 738,000.
The adjustment at the current level shows that Bitcoin starting with 7 can be seen. Currently, th
View Original
  • Reward
  • 3
  • Share
CallMeMr.Kvip:
Hope the bearish traders can make money
View More
Trade Crypto Anywhere Anytime
qrCode
Scan to download Gate app
Community
English
  • 简体中文
  • English
  • Tiếng Việt
  • 繁體中文
  • Español
  • Русский
  • Français (Afrique)
  • Português (Portugal)
  • Bahasa Indonesia
  • 日本語
  • بالعربية
  • Українська
  • Português (Brasil)