Gate Research: Web3 On-Chain Data Insights for May 2025|Solana Remains Red-Hot, Injective Emerges Strongly, BTC Whales Steadily AccumulateWeb3 On-Chain Analysis
Abstract
- Solana maintained its lead in transaction volume, processing over 3.1 billion transactions in total; Base saw rapid growth, with over 300 million transactions in May alone.
- Injective attracted a net inflow of $130 million in May, driven by its strategic focus on RWA and on-chain U.S. stock trading, positioning itself as a rising blockchain for financial infrastructure.
- Bitcoin’s accumulation trend score remained high, indicating continued institutional buying throughout May and supporting its upward momentum.
- The share of BTC on-chain volume flowing through exchanges rose to 33%, signaling increased capital activity and improving market sentiment.
- As of May 31, 2025, the LetsBonk.fun platform had issued over 105,000 tokens, with a graduation rate of approximately 1.25%.
- $VIRTUAL saw a sharp rise in both active addresses and gas fees, highlighting a shift from narrative-driven hype to real user adoption and strong on-chain fundamentals.
On-Chain Insights Overview
Overview of On-Chain Activity and Capital Flow
Beyond analyzing overall capital flows on-chain, we have selected several key activity metrics to better evaluate the actual usage intensity and engagement levels across different blockchain ecosystems. These indicators include daily transaction volume, daily gas fees, daily active addresses, and net cross-chain bridge flows—capturing multiple dimensions of user behavior, network utilization, and asset mobility. Compared to simply tracking capital inflows and outflows, these native on-chain metrics offer a more comprehensive view of the fundamental shifts in blockchain ecosystems. They help assess whether capital movement is accompanied by real user demand and usage growth, thus identifying networks with sustainable development potential.
Transaction Volume Comparison: Solana Maintains Lead, Base and Sui See Rapid Growth
According to Artemis data as of May 31, 2025, the average daily transaction volumes over the past three months show a clear divergence among major blockchains. Solana remains the undisputed leader, having processed over 3.1 billion cumulative transactions—far surpassing other chains. Its high-frequency activity is largely driven by dense deployment of meme coins, GameFi, and bot applications, highlighting its strong throughput and ecosystem vibrancy.
Base also delivered an impressive performance, with over 300 million transactions in May alone. This exceeds Arbitrum (~66 million) and Polygon PoS (~94 million), and reflects its user growth momentum fueled by SocialFi and emerging Layer 2 applications. Since April, Base’s transaction volume has risen steadily, and it is gradually surpassing more established L2 networks to become a major focus for both capital and user attention.
Sui’s recent transaction growth is also notable, with 156 million cumulative transactions showing a consistently upward trend in the charts. This growth is primarily attributed to its Move-based game and NFT application ecosystem taking shape. In contrast, traditional Layer 1 leaders Ethereum (41.98 million) and Bitcoin (12 million) have maintained relatively stable transaction rhythms, illustrating their high-value, low-frequency usage profiles. Meanwhile, other Ethereum scaling solutions have shown stable volumes but comparatively weaker growth dynamics than Base and Sui, suggesting a rotation of capital is underway.
Overall, emerging blockchains and high-performance Layer 2s are gradually challenging the dominance of traditional networks at the transactional layer. Shifts in transaction volume not only reflect user engagement levels but also often signal changing capital flows and evolving ecosystem priorities. Continuous monitoring of the interaction quality on high-frequency platforms will be essential to assess whether their momentum has long-term sustainability.[1]

Gas Fee Rankings: Solana Takes the Lead, Ethereum Remains the Core for High-Value Transactions
According to data from Artemis, as of May 31, 2025, Solana surpassed Ethereum in total on-chain fee revenue, becoming the top-earning blockchain for the month. Solana’s total gas fees in May reached $53.06 million, fueled by extremely high transaction frequency and the explosive growth of Meme coins, bots, and gaming ecosystems. Although Solana charges extremely low fees per transaction, its billion-level daily transaction volume translates into significant revenue, demonstrating a “scale-through-volume” effect.
Ethereum followed with $42.41 million in cumulative fees, temporarily falling behind Solana in total revenue. However, Ethereum continues to hold a clear advantage in terms of per-transaction value, contract complexity, and institutional capital density, serving as the primary network for high-value on-chain transactions and DeFi applications. Its daily gas fees consistently exceed $1 million, reflecting users’ willingness to pay a premium for reliability and security in critical financial operations.
Among Layer 2 networks, Base led with $5.87 million in total gas fees, reflecting its increasingly active ecosystem. Arbitrum and Sui recorded $990k and $1.92 million respectively, with stable levels of activity. Polygon PoS, despite having substantial transaction volume, generated only $340k in gas fees, indicating its orientation toward lightweight use cases.
Overall, while Solana topped the fee revenue chart through sheer usage volume, Ethereum remains irreplaceable as a high-value transaction network. The two represent distinct models of on-chain economic growth: one driven by extreme scalability and high-frequency applications, the other built on strong financial attributes and deep interaction quality.[2]

Active Address Analysis: Solana Dominates, While Base and Sui Continue Expanding
According to Artemis data, as of May 31, 2025, Solana leads by a wide margin with an average of over 4.95 million daily active addresses—far ahead of other blockchains. This large user base primarily stems from high-frequency, lightweight applications such as meme coins, gaming ecosystems, bots, DEXs, and Telegram tools, solidifying its position as the “public chain with the largest active user base.”
Base recorded an average of 1.51 million daily active addresses, the best performer among Layer 2 networks. With its transaction volume and gas fees rising in tandem, it reflects a stable pace of ecosystem expansion and user onboarding. The user base is gradually shifting from early-stage speculation to long-term participation.
Sui followed with 980k daily active addresses and continued upward momentum. Its growth is driven by real user inflows in the NFT, blockchain gaming, and creator economy sectors, contributing to steadily increasing ecosystem activity.
In contrast, Bitcoin (510k), Ethereum (410k), and Polygon PoS (520k) maintained relatively stable active address counts, indicative of their “low-frequency, high-value” usage profiles—mainly for settlement, DeFi, and cross-chain transfers. Arbitrum showed weaker performance, with an average of 230k daily active addresses in May. Despite maintaining notable transaction volume, its user growth has slowed, potentially facing competitive pressure from the differentiated approaches of Base and Sui.
Overall, Solana is building a massive user base through high-frequency interactions, while Base and Sui demonstrate strong momentum in user penetration. Going forward, the focus of public chain competition is shifting from TVL and transaction volume toward active user scale and ecosystem retention quality.[3]

Three Core On-Chain Metrics Reveal the New Landscape of Public Chain Competition
While Solana continues to dominate in transaction volume, both Base and Sui showed remarkable growth momentum in May. Base maintained a daily average of around 10 million transactions, with over 300 million transactions recorded for the month. Its total gas fee revenue reached $5.87 million, securing the top position among Layer 2 networks. Additionally, Base surpassed 46 million active addresses, building a sticky social ecosystem driven by SocialFi and meme-based applications.
Sui followed closely with 6 million daily transactions and 30 million active addresses, maintaining strong momentum. While its current fee revenue remains relatively low, its high-frequency interaction model and Move-native ecosystem give it an edge as a developer-friendly network for gaming and creator-focused applications. Compared to Solana, both chains are smaller in scale but are growing rapidly and building high-retention engagement models, laying the foundation for a new generation of scalable public chains.
In summary, Solana continued to lead across transaction volume, active addresses, and gas fees during April and May. With meme coin ecosystems and aggregators fueling usage, Solana has built a compounding, high-frequency feedback loop. Platforms like Pump.fun consistently generate over 10,000 new tokens per day, while Jupiter provides liquidity aggregation, forming a fast and lightweight token issuance and trading pipeline. Meanwhile, emerging chains like Base and Sui are narrowing the gap with traditional leaders by leveraging lightweight applications, signaling a shift in public chain competition toward “user participation as the core growth driver.”
Cross-Chain Capital Flows: Market Preferences and Structural Realignment Advancing in Tandem
According to Artemis data, net capital flows across major blockchains in May 2025 showed clear divergence, with rapid capital rotation between ecosystems reflecting evolving market preferences and asset allocation strategies. Ethereum attracted approximately $365 million in net inflows, maintaining its status as the most capital-attractive public chain and demonstrating robust absorption capacity.
Base also performed strongly, drawing in around $96 million in inflows amid growing on-chain activity and sustained ecosystem expansion.
The standout performer among emerging chains was Injective, which recorded $130 million in net inflows in a single month. This surge is closely tied to its active push into the RWA (real-world assets) and derivatives sectors. In early May, Injective launched on-chain U.S. stock asset trading under the iAsset framework, enabling price mapping and leveraged trading of tech giants such as Apple and NVIDIA, sparking significant market interest. The launch of institutional strategy platforms and continued enhancements to user experience on Helix DEX further boosted capital efficiency and user retention, positioning Injective as a rising infrastructure layer for on-chain finance.
In contrast, Berachain posted the highest outflows among all chains, with approximately $595 million withdrawn in May—extending April’s $704 million exodus. This indicates continued capital retreat from early speculative inflows and reflects lingering market caution. OP Mainnet also saw $176 million in outflows, following a similar trend of weakness after April’s $400 million capital exit.
Overall, capital is gradually shifting away from overvalued or narrative-driven projects lacking real application support, returning instead to core assets like Ethereum with strong absorption capacity, while also rotating into emerging ecosystems with tangible user growth and potential. Chains such as Solana, Avalanche, and Blast experienced varying levels of outflows, suggesting a temporary cooling of enthusiasm for certain Layer 1 and Layer 2 networks. Whether this capital migration translates into renewed on-chain activity and ecosystem expansion remains to be seen, and will be key to fueling the next phase of market growth.[4]

Amid the ongoing cross-chain capital rotation, Bitcoin—as the market’s core asset—has also exhibited key signals through its on-chain structural indicators. The following section will focus on Bitcoin’s on-chain behavior, including major holder activity, profit realization dynamics, and exchange-level engagement, to assess whether the current market rally is backed by structural support.
Key Bitcoin Metrics Analysis
As BTC reaches new all-time highs and market sentiment continues to heat up, relying solely on price fluctuations is no longer sufficient to fully grasp market dynamics. To systematically evaluate the current market structure and capital behavior, this report selects four representative on-chain indicators—Accumulation Trend Score, Relative Unrealized Profit, Volatility-Adjusted Net Realized Profit/Loss, and Exchange Volume Dominance to analyze capital flow from multiple dimensions: institutional accumulation, unrealized profit pressure, profit-taking behavior, and overall trading activity. These indicators not only reflect short-term sentiment but also help identify structural support or hidden risks, offering valuable insights into the health and sustainability of the ongoing rally.
BTC Accumulation Trend Score Remains High as Institutional Inflows Continue in May
The Accumulation Trend Score measures whether BTC is being actively accumulated by large entities on-chain. A score closer to 1 indicates that large-balance addresses are net accumulating, signaling strong institutional buying interest; conversely, lower values reflect more fragmented or cautious market behavior. This metric combines address balances and 30-day holding changes to intuitively reveal capital movements across different investor cohorts.
According to Glassnode data, BTC’s Accumulation Trend Score remained in the high range of 0.8 to 1.0 throughout May 2025, even after the price broke through $110,000 to hit a new all-time high. Rather than triggering profit-taking, the rally was met with continued accumulation. The chart’s persistent dark purple zones show that wallets with significant BTC balances continued buying in unison during May. Notably, the score climbed further during the week of May 22, when BTC hit its recent high, suggesting that instead of growing cautious, the market attracted more mid- to long-term investors. This indicates the rally is still structurally supported by incoming capital.
This behavior mirrors previous peaks in March and December 2024, where strong price action was similarly backed by accumulation. It differs, however, from the late-2021 market top, where despite high accumulation scores, profit-taking quickly led to a downtrend. In contrast, current capital inflows remain concentrated with no signs of distribution, suggesting the market is not yet in an overheated or topping phase.
Overall, the sustained high Accumulation Trend Score sends a clear signal: the current BTC rally is not driven by short-term speculation but by solid institutional support and a continuation of an underlying bullish trend. As a mid-term structural indicator, it reinforces that BTC remains in a capital-led growth phase with strong momentum and durable support.[5]

BTC Relative Unrealized Profit Surpasses +2σ, Indicating Profit-Taking Pressure Nearing Peak
Relative Unrealized Profit is an optimized version of the traditional unrealized profit metric, excluding internal transfers between addresses belonging to the same entity. This refinement ensures the indicator reflects actual economic activity, offering more accurate market signals than the original UTXO-based version.
According to Glassnode data, as of May 2025, Bitcoin’s Relative Unrealized Profit has consistently surpassed the +2σ (standard deviation) level, indicating that the market’s unrealized gains are within historically high ranges. This phase typically corresponds to heightened investor sentiment. Historically, only a few trading days have reached or exceeded this threshold, usually near bull market peaks. In particular, as BTC surged past $110,000, this indicator spiked rapidly, suggesting that many holders are sitting on substantial unrealized profits.
However, unlike the sharp sell-offs observed at the end of the 2017 and 2021 bull markets, there has been no clear sign of mass profit-taking so far. Despite the significant paper gains, market participants have not rushed to exit positions en masse.
Overall, the current trend suggests the market is in a classic high-profit phase. If the metric remains above +2σ, it may signal rising potential for selling pressure. Conversely, if price consolidation is accompanied by a gradual decline in the indicator, it could indicate a healthy correction. Investors should closely monitor subsequent capital flows and sentiment shifts to assess whether the market is entering an overheated phase.[6]

BTC Volatility-Adjusted Net Realized Profit/Loss Continues to Climb, Indicating Strong Profit-Taking Behavior On-Chain
The Volatility-Adjusted Net Realized Profit/Loss (VA-NRPL) metric represents realized profits and losses denominated in BTC, adjusted by Bitcoin’s market cap growth and 7-day price volatility. This adjustment allows for a more accurate assessment of actual profitability across varying market conditions.
According to Glassnode data, as of May 2025, the VA-NRPL for BTC has continued to rise steadily, indicating a significant increase in realized profits. This trend suggests that investors are locking in gains more frequently, with on-chain capital showing a strong inclination toward profit realization. Following BTC’s breakout to new highs, the metric accelerated sharply and is now approaching historically “high-profit” zones. While the broader market may not yet be in an extreme bubble phase, the rise in on-chain realized gains reflects growing sell-side activity, implying that some capital may be rotating into exchanges for monetization.[7]
In conjunction with the Accumulation Trend Score and Relative Unrealized Profit metrics, this pattern reveals a nuanced market structure: while major entities continued accumulating throughout May (with the trend score staying above 0.8), profit-taking pressure also mounted. This indicates that the rally is not purely driven by speculative behavior but is structurally supported by institutional positioning, accompanied by natural capital rotation and partial exits.
Overall, May marked a high-profit phase for BTC, with on-chain behavior reflecting both proactive accumulation and phased profit realization. If prices consolidate and the metric gradually declines, it may signal a healthy correction. However, if sentiment deteriorates rapidly, investors should be cautious of increased short-term volatility and potential pullbacks. At this stage, it is advisable to monitor net on-chain capital flows, exchange inflows, and funding rates to assess whether the market is entering an overheated zone.

BTC Exchange Volume Dominance Rises to 33%, Signaling Increased Capital Activity and Market Sentiment
The Exchange Volume Dominance metric measures the proportion of all BTC on-chain transactions that interact with exchange addresses, including both deposits and withdrawals. An upward trend in this indicator typically reflects heightened trading sentiment and increased investor participation, especially when prices break through key resistance levels and enter price discovery phases.
According to Glassnode data, as of May 2025, BTC’s interaction with centralized exchanges has significantly intensified. Since BTC surpassed $109,000 earlier this year and reached new all-time highs, the exchange volume dominance has steadily climbed—now reaching approximately 33% of total on-chain volume, marking a one-year high.[8]
The continued rise in exchange volume dominance throughout May corresponds with BTC maintaining strong momentum within a high-level consolidation range. It suggests that investors are increasingly active—whether positioning for further upside or realizing gains—leading to a notable uptick in overall capital movement. This trend provides valuable insight into evolving market sentiment and serves as a key signal for monitoring future shifts in on-chain net flows.
In summary, the surge in exchange-related activity during May is a strong indication of renewed market liquidity and rising sentiment. It is essential to watch whether this trend leads to mounting sell pressure or sustained capital inflows moving forward.

Market Trend Summary
In May 2025, the competitive landscape of on-chain ecosystems continued along the trajectory established in April. Solana maintained its lead in both transaction volume and gas revenue, with user activity remaining the highest among all networks. Base and Sui showed strong growth momentum, with notable increases in interactions and fee generation, establishing themselves as key emerging Layer 1s. In terms of capital flows, Ethereum attracted the most inflows, while Injective drew in $130 million, driven by its strategic positioning in RWA and on-chain U.S. stock applications—further solidifying its role as a foundational infrastructure for on-chain finance. In contrast, Berachain and OP Mainnet saw significant outflows for the second consecutive month, reflecting a cooling of earlier narrative-driven hype.
For Bitcoin, the Accumulation Trend Score remained elevated, signaling continued inflows from major investors. Although the Relative Unrealized Profit exceeded two standard deviations—indicating the market is in a high-profit phase—there have been no signs of broad profit-taking or a market top. Meanwhile, the exchange volume dominance rose to 33%, highlighting increased capital activity and a warming of investor sentiment, suggesting that the current price action remains within a healthy uptrend.
Overall, capital and users are increasingly flowing toward ecosystems with real interaction and application scenarios. While leading chains maintain their dominance, emerging networks are rapidly narrowing the gap. The competitive dynamic of Layer 1s is now entering a new phase centered on “user retention” and “sustained value capture.”
Trending Projects & Token Activity
Overview of Popular Project Data
LetsBonk.fun
LetsBonk.fun officially launched at the end of April 2025 as a meme coin issuance and trading platform built on Solana. It features one-click token creation, community-driven dynamics, and a lightweight, entertainment-oriented experience. By combining the Bonk community culture with Solana’s high-performance blockchain infrastructure, the project drew massive user participation on day one, quickly igniting a new wave of meme coin activity on-chain.
According to Dune data, as of May 31, 2025, the LetsBonk.fun platform had issued over 105,000 meme coins, with more than 1,317 tokens reaching “graduation” status (meeting platform-defined thresholds for activity and holder count), resulting in a graduation rate of approximately 1.25%, and a total market cap exceeding $60 million. [9]
In terms of daily issuance trends, May 10 marked the platform’s peak in traffic and meme creation, with over 12,000 tokens launched in a single day and a graduation rate of 1.47%. Although activity moderated after the peak, the platform maintained a robust pace of 3,000–5,000 new tokens issued daily over the following two weeks, indicating sustained user engagement and creation. The continued growth in cumulative issuance affirms LetsBonk.fun’s enduring appeal as a meme coin creation tool within the Solana ecosystem.

In terms of token market cap structure, only two tokens—Hosico and USELESS—have surpassed a market cap of $10 million, establishing themselves as leading representatives on the platform. An additional six tokens (such as KAKA, gib, and LetsBonk) fall within the $1 million to $10 million range, indicating a preliminary level of community support and trading depth. However, the vast majority of tokens remain in the small-cap category: 1,289 tokens have a market cap below $100,000, accounting for a striking 97.8%. This underscores that the platform still primarily operates under a high-frequency issuance and rapid-elimination model typical of meme coin experimentation.

In terms of holder addresses, USELESS currently has the largest user base, with 8,609 holding addresses. Other tokens such as KAKA, LetsBonk, and Hosico also each have over 6,000 addresses, indicating that these communities have already reached a notable level of engagement and scale.

Overall, LetsBonk.fun has successfully built a high-frequency meme coin issuance and trading platform within just one month. As of now, over 100,000 tokens have been issued on the platform, with the number of “graduated” tokens steadily increasing—reflecting strong user engagement and platform activity. As the number of projects and the distribution of market capitalizations continue to expand, the platform is forming the early structure of a self-sustaining ecosystem. Going forward, it will be important to observe whether more tokens can evolve from low market cap assets into mid-or high-cap assets, becoming genuine on-chain hot spots and further solidifying LetsBonk.fun’s role as a social and liquidity hub within the Solana ecosystem.
At the same time as LetsBonk.fun’s rapid rise, several other meme token launch platforms have emerged on Solana, collectively competing for attention in this high-frequency, community-driven market. According to Dune data, as of May 31, 2025, there are more than eight active meme launchpad projects on Solana. The most dominant remains Pump.fun, followed by LetsBonk.fun, LaunchLab, Boop, and others.[10]
In terms of total tokens launched, Pump.fun still holds an absolute lead—on May 31 alone, it recorded over 23,000 token launches, accounting for 87.3% of the market share, significantly ahead in both scale and penetration. In contrast, LaunchLab and LetsBonk.fun reported 1,500 and 1,181 token launches respectively, capturing 5.6% and 4.4% of the market. While the gap with the leader remains substantial, both emerging platforms have established relatively stable active user bases and demonstrate promising growth potential.

In terms of graduated tokens, Pump.fun also maintains a significant lead, with 193 tokens successfully graduating on May 31 alone. In comparison, LaunchLab and LetsBonk.fun recorded only 5 and 3 graduated tokens respectively during the same period. This highlights that despite the high volume of token launches, only a small fraction of projects manage to achieve sufficient traction and market acceptance.
Overall, graduation rates across platforms remain low, reflecting that the current meme token ecosystem is largely characterized by “high-frequency experimentation and low retention.” Most projects have short life cycles, and user engagement tends to concentrate in the early phases of hype and speculation rather than long-term commitment.

In terms of user activity, Pump.fun also holds an absolute lead, with over 140,000 daily active addresses, far ahead of second-tier platforms. LaunchLab and LetsBonk.fun recorded 5,370 and 5,248 active addresses respectively, showing a close and competitive race, with both platforms having a relatively solid user base. In contrast, platforms like Boop and Moonshot have significantly fewer daily active users and remain on the fringes of the ecosystem, with limited overall impact.

Overall, the landscape of meme token launch platforms on Solana continues to exhibit a “one dominant, many strong” dynamic. Pump.fun maintains its market leadership through first-mover advantage and strong network effects. Meanwhile, LetsBonk.fun and LaunchLab are steadily gaining traction within niche communities, emerging as key sources of incremental growth beyond the dominant platform. Looking ahead, the ability to improve graduation rates, token quality, and user retention may determine which platform can disrupt the current ecosystem hierarchy and contend for the next wave of dominance.
Overview of Popular Token Data
$VIRTUAL —— Virtuals Protocol is an innovative platform that merges blockchain and artificial intelligence, aiming to build a decentralized ecosystem of AI agents. Users can easily create AI agents capable of multimodal interaction—text, voice, and 3D animation—and operate seamlessly across major platforms such as Roblox, TikTok, and Telegram games. This introduces a new paradigm for virtual economies and user interaction.
Driven by the overall strength of the AI sector, $VIRTUAL has performed exceptionally well in recent weeks, maintaining a steady upward trend since April. From a technical perspective, the 30-day moving average has provided solid mid-term support, clearly guiding the trend and helping $VIRTUAL sustain its upward momentum—making it one of the standout projects in the AI narrative.
Meanwhile, on May 28, 2025, Grayscale announced the launch of a dedicated AI crypto sector, marking its sixth industry classification. This new sector consolidates 20 previously scattered AI projects with a combined market cap of around $20 billion, accounting for just 0.67% of the total crypto market—making it the smallest among all sectors. In contrast, the finance sector holds a market cap of $519 billion. Grayscale noted that the AI sector’s relatively small size indicates it is still in its early stages, with substantial growth potential ahead.
On-Chain Fundamentals Overview: Virtuals Protocol Transitions from Narrative Hype to Real Usage
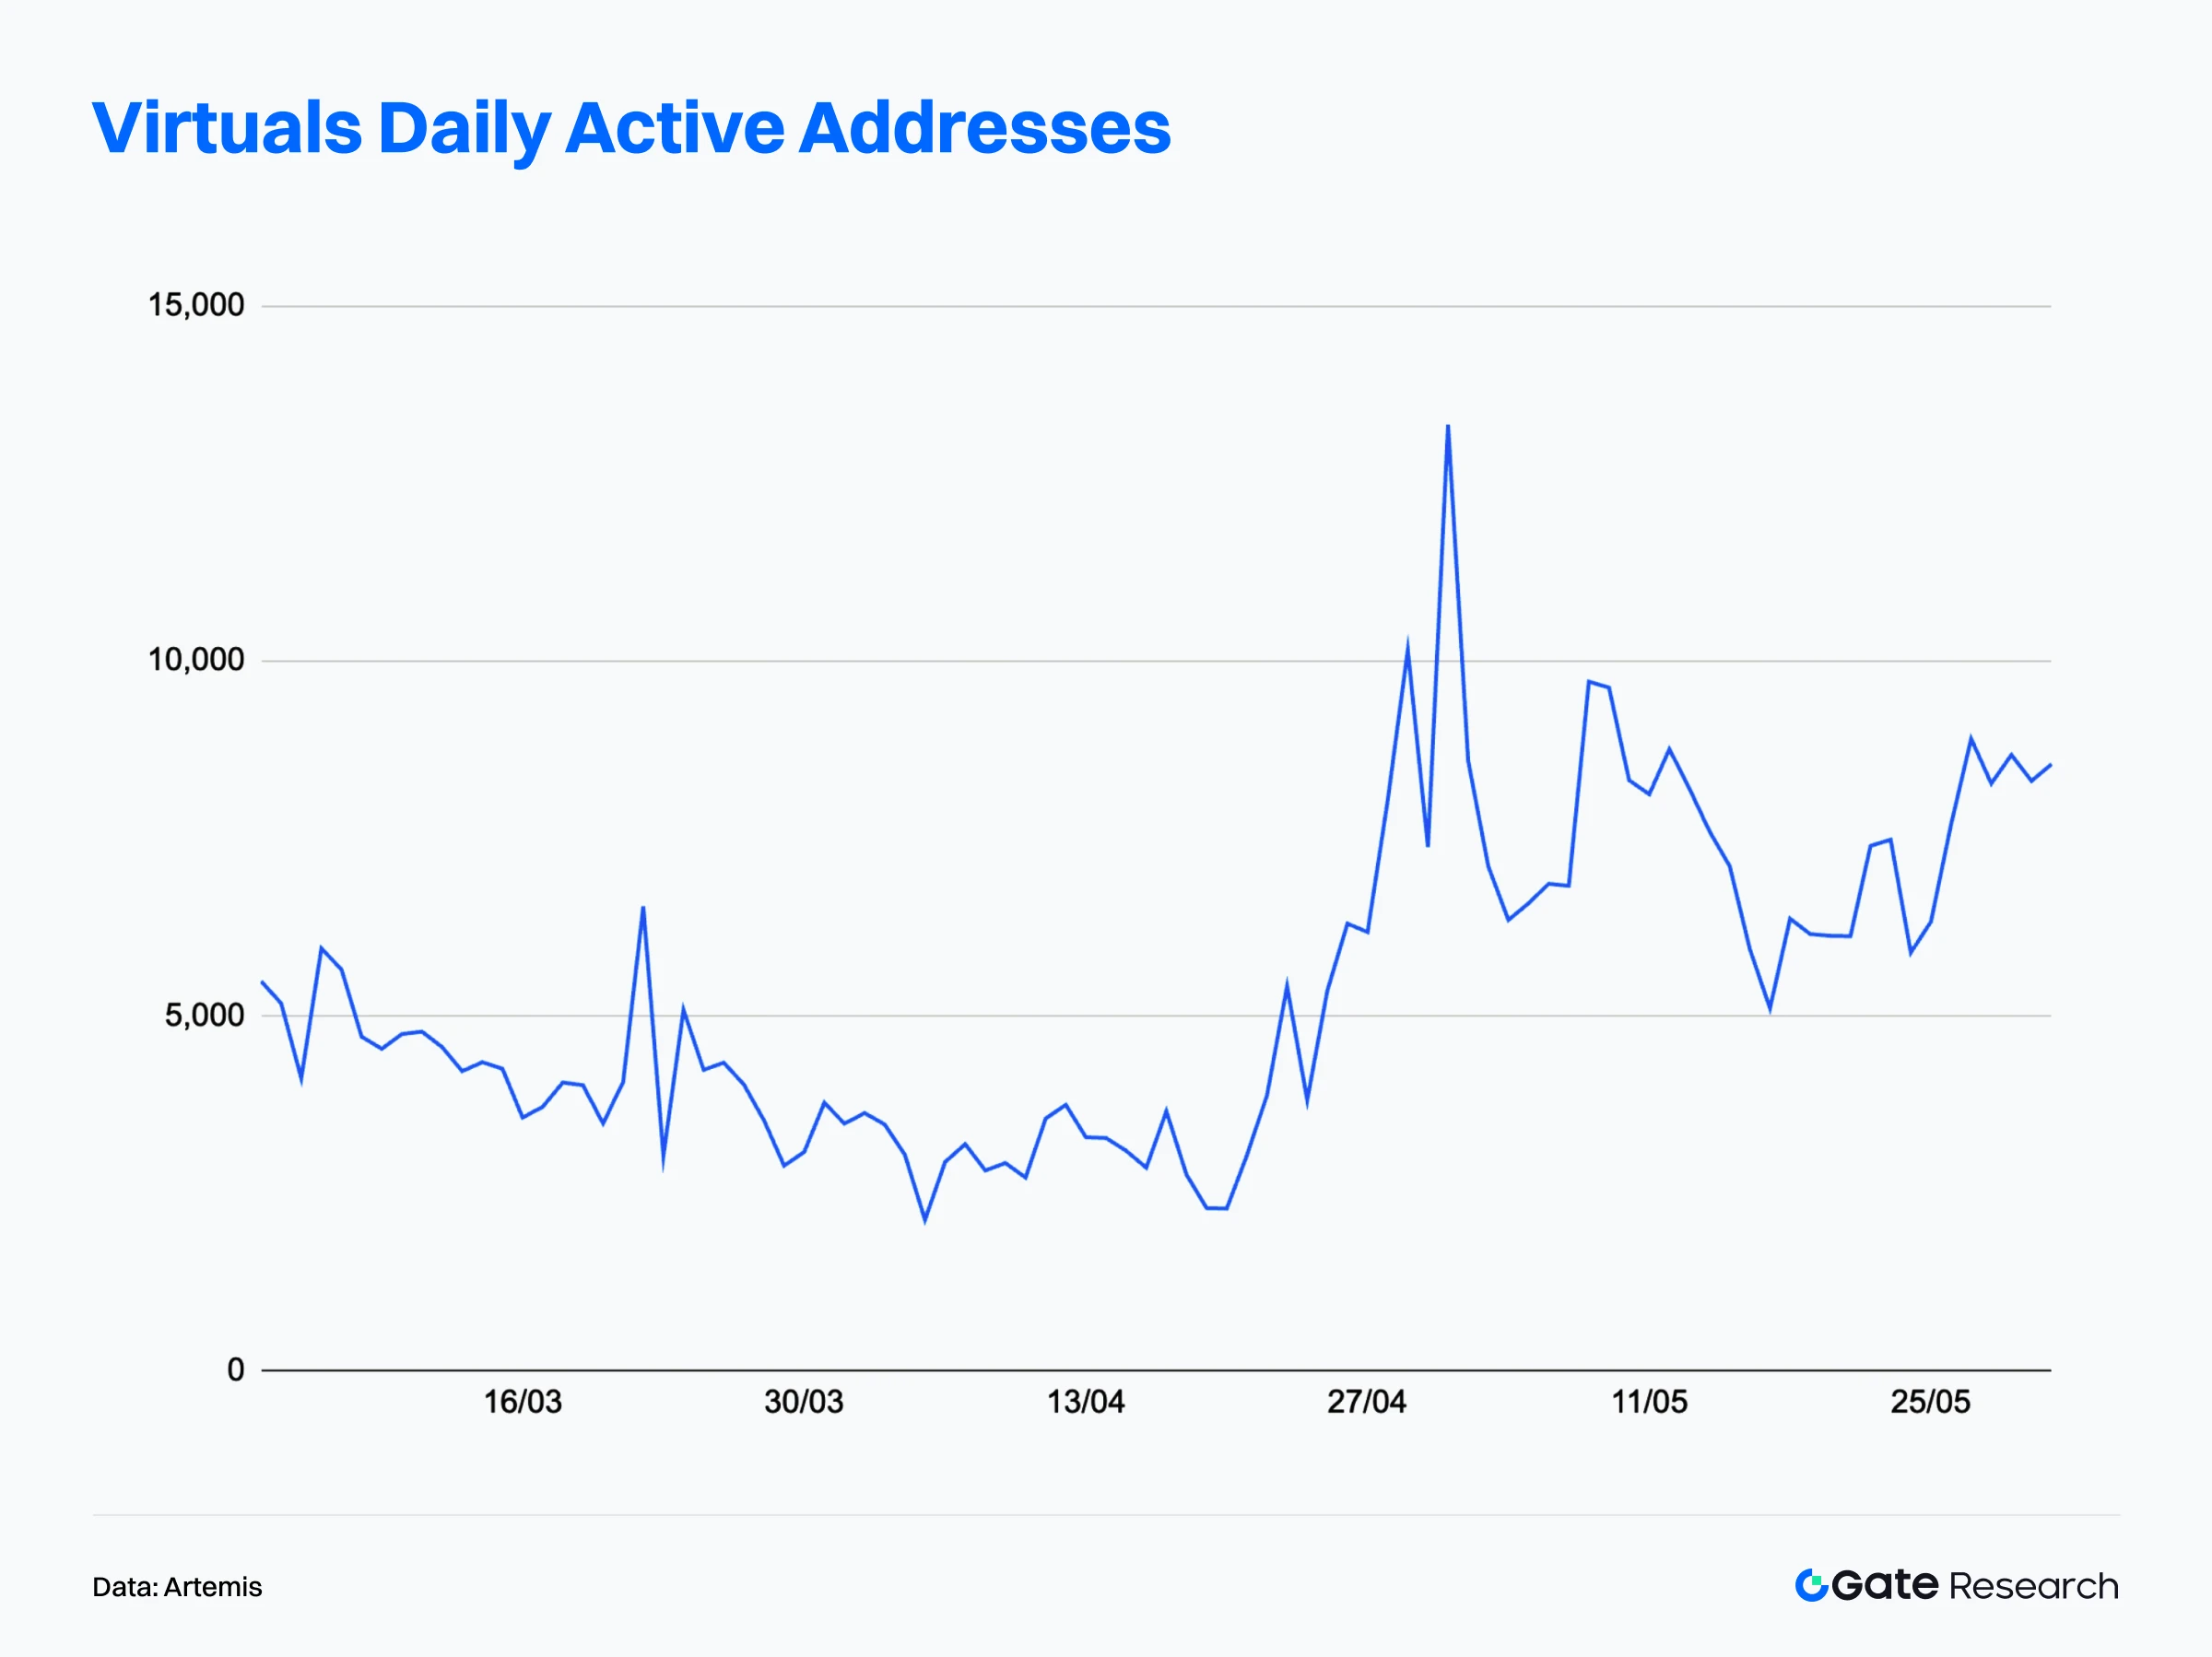
In May 2025, $VIRTUAL recorded an average of approximately 7,600 daily active on-chain addresses, marking a nearly 89% increase from April. This reflects a structurally steady uptrend characterized by a “low-base breakout” rather than a speculative spike. Although Grayscale didn’t officially announce the inclusion of AI in its crypto sector until May 28, $VIRTUAL’s user activity had already surged significantly earlier in the month—indicating that its growth was primarily driven by intrinsic utility rather than short-term hype triggered by the announcement. [11]
From a technical perspective, after a burst of momentum in late April, the token experienced a mild consolidation at the beginning of May. However, its price and user base showed a “stepwise ascent,” where the base level gradually lifted, reflecting a behavior pattern of phased entry, observation, and reaccumulation by users. Interestingly, after the Grayscale announcement, on-chain activity stabilized rather than spiked, with daily active addresses ranging consistently between 7,500 and 9,500, suggesting a shift toward a more mature and retained user base.
Overall, $VIRTUAL completed a notable transition in May—from narrative-driven attention to sustained user engagement. Its growing on-chain stickiness likely stems from practical integrations such as AI agent deployment, Telegram-based interaction, or Web3 gaming integration. Compared to short-lived speculative projects, $VIRTUAL increasingly resembles a core asset at the heart of an emerging AI-as-a-Service on-chain application ecosystem.
In addition to the surge in active addresses, Virtuals Protocol also saw a significant increase in on-chain fees throughout May 2025, further validating the platform’s genuine user engagement and intensity of actual usage. According to data from Artemis, total on-chain fees for May exceeded $4 million, with a daily average of around $130,000—a more than 300% month-over-month increase compared to April’s average of just $30,000. This remarkable growth was not only driven by the overall rise in ecosystem activity but also significantly boosted by the platform’s newly introduced “Contribution Points” incentive mechanism. Under this model, users must actively interact on-chain to accumulate points, which qualify them to participate in early-stage events like Genesis Launch. This effectively incentivized continuous user interaction and spending on transactions, laying the groundwork for the surge in fees.
From a trend perspective, on-chain fee volume began to expand in late April and maintained an upward trajectory with moderate fluctuations throughout May, eventually peaking on May 29, when single-day fees exceeded $310,000. These fees are often attributed to AI agent deployment, model invocation, and virtual character generation, all of which involve complex interactions. This indicates that users are not merely engaging in superficial or routine activity, but are actively participating in Virtuals’ core products and content ecosystem.
Notably, this spike in fee activity occurred before Grayscale’s May 28 announcement to include AI in its crypto sector index, suggesting that the market had already anticipated the narrative shift, and that user behavior had preemptively aligned with that expectation. Even as user growth plateaued later in the month, on-chain fees remained high—signaling an improvement in user quality and engagement depth, as users continue to pay for meaningful features and functionality.

By combining the two core metrics—active addresses and on-chain fees—Virtuals Protocol demonstrates a clear trend of “scaling in both quantity and quality.” Not only has the platform attracted a large influx of users, but it has also driven sustained user willingness to pay on-chain, laying the foundation for a nascent yet increasingly robust revenue structure.
As one of the earliest native protocols within the AI sector to achieve high on-chain interaction density, $VIRTUAL is steadily transitioning away from speculative hype, moving toward a mid-to-long-term growth trajectory supported by real-world applications.
Conclusion
In May 2025, the competitive landscape of the on-chain ecosystem continued its trajectory from the previous month. Solana maintained its dominance in user interactions with over 3.1 billion transactions, while its active address count and gas revenue remained high, underscoring a robust user base and strong ecosystem stickiness. Base showed the most rapid growth, surpassing 300 million transactions, with social applications driving its active users past 46 million, signaling the rapid expansion of a lightweight social ecosystem. Sui also exhibited steady growth, with increased interaction frequency driven by gaming and creator-focused applications, exemplifying a new “high-frequency, lightweight” Layer 1 model.
On the capital front, Injective led among emerging chains with $130 million in net inflows, fueled by its active push into RWA and on-chain U.S. stock trading. Ethereum maintained its strong capital absorption capacity, while Berachain and OP Mainnet continued to experience significant outflows, reflecting waning market confidence in certain narrative-driven projects.
In terms of Bitcoin indicators, institutional capital remained in accumulation mode, with the Accumulation Trend Score staying elevated. Both Relative Unrealized Profit and Volatility-Adjusted Net Realized Profit/Loss continued to climb, indicating rising paper profits and partial profit-taking behavior. Meanwhile, exchange interaction volume rose to 33%, signaling increased capital activity and market participation, with the structural outlook still appearing supportive.
Among notable projects, LetsBonk.fun saw its total token issuance surpass 100,000, though its “graduation rate” remained low at 1.25%, reflecting short-term hype, low survival rates, and a highly speculative atmosphere. In contrast, Virtuals Protocol emerged as a standout example of a project moving from narrative to real utility, with sharp increases in both active on-chain users and fees, driven by the real-world deployment of AI agents.
Overall, on-chain interactions, capital flows, and user behavior are evolving in tandem. The focus of ecosystem competition is shifting from raw infrastructure performance to real application use cases and user retention capability. Going forward, it is recommended to closely monitor the growth paths of emerging chains, capital flow dynamics, and the on-chain activity quality of trending projects.
References:
- Artemis, https://app.artemisanalytics.com/chains
- Artemis, https://app.artemisanalytics.com/chains
- Artemis, https://app.artemisanalytics.com/chains
- Artemis, https://app.artemisanalytics.com/flows
- Glassnode, https://studio.glassnode.com/charts/indicators.AccumulationTrendScore?a=BTC&mScl=log&pScl=log&resolution=24h&s=1590670050&u=1748436450
- Glassnode, https://studio.glassnode.com/charts/8283c27a-2f48-44a7-7c02-ca42ae276de1?s=1590670050&u=1748436450
- Glassnode, https://studio.glassnode.com/charts/indicators.SoprAccountBased?a=BTC&mScl=lin&pScl=lin&resolution=24h&s=1590670072&sma=7&u=1748436472
- Glassnode, https://studio.glassnode.com/charts/c2dc5394-7069-4983-4771-7a13109c5fd6
- Dune, https://dune.com/oladee/lets-bonk
- Dune, https://dune.com/adam_tehc/memecoin-wars
- Artemis, https://app.artemisanalytics.com/asset/virtuals?from=assets&tab=metrics
Gate Research is a comprehensive blockchain and cryptocurrency research platform that provides users with in-depth articles, including technical analysis, market insights, market reviews, industry research, trend forecasting, and macroeconomic policy analysis.
Disclaimer
Investing in the cryptocurrency market carries a high level of risk. Users are advised to conduct independent research and fully understand the nature of the assets and products they intend to purchase before making any investment decisions. Gate assumes no responsibility for any losses or damages resulting from investment decisions.
Related articles

Reflections on Ethereum Governance Following the 3074 Saga

Gate Research: BTC Breaks $100K Milestone, November Crypto Trading Volume Exceeds $10 Trillion For First Time

NFTs and Memecoins in Last vs Current Bull Markets

Gate Research: 2024 Cryptocurrency Market Review and 2025 Trend Forecast

Detailed Analysis of the FIT21 "Financial Innovation and Technology for the 21st Century Act"
