Shiba Inu breaks through months-long resistance level: What drove the 15% rally?
Market Review
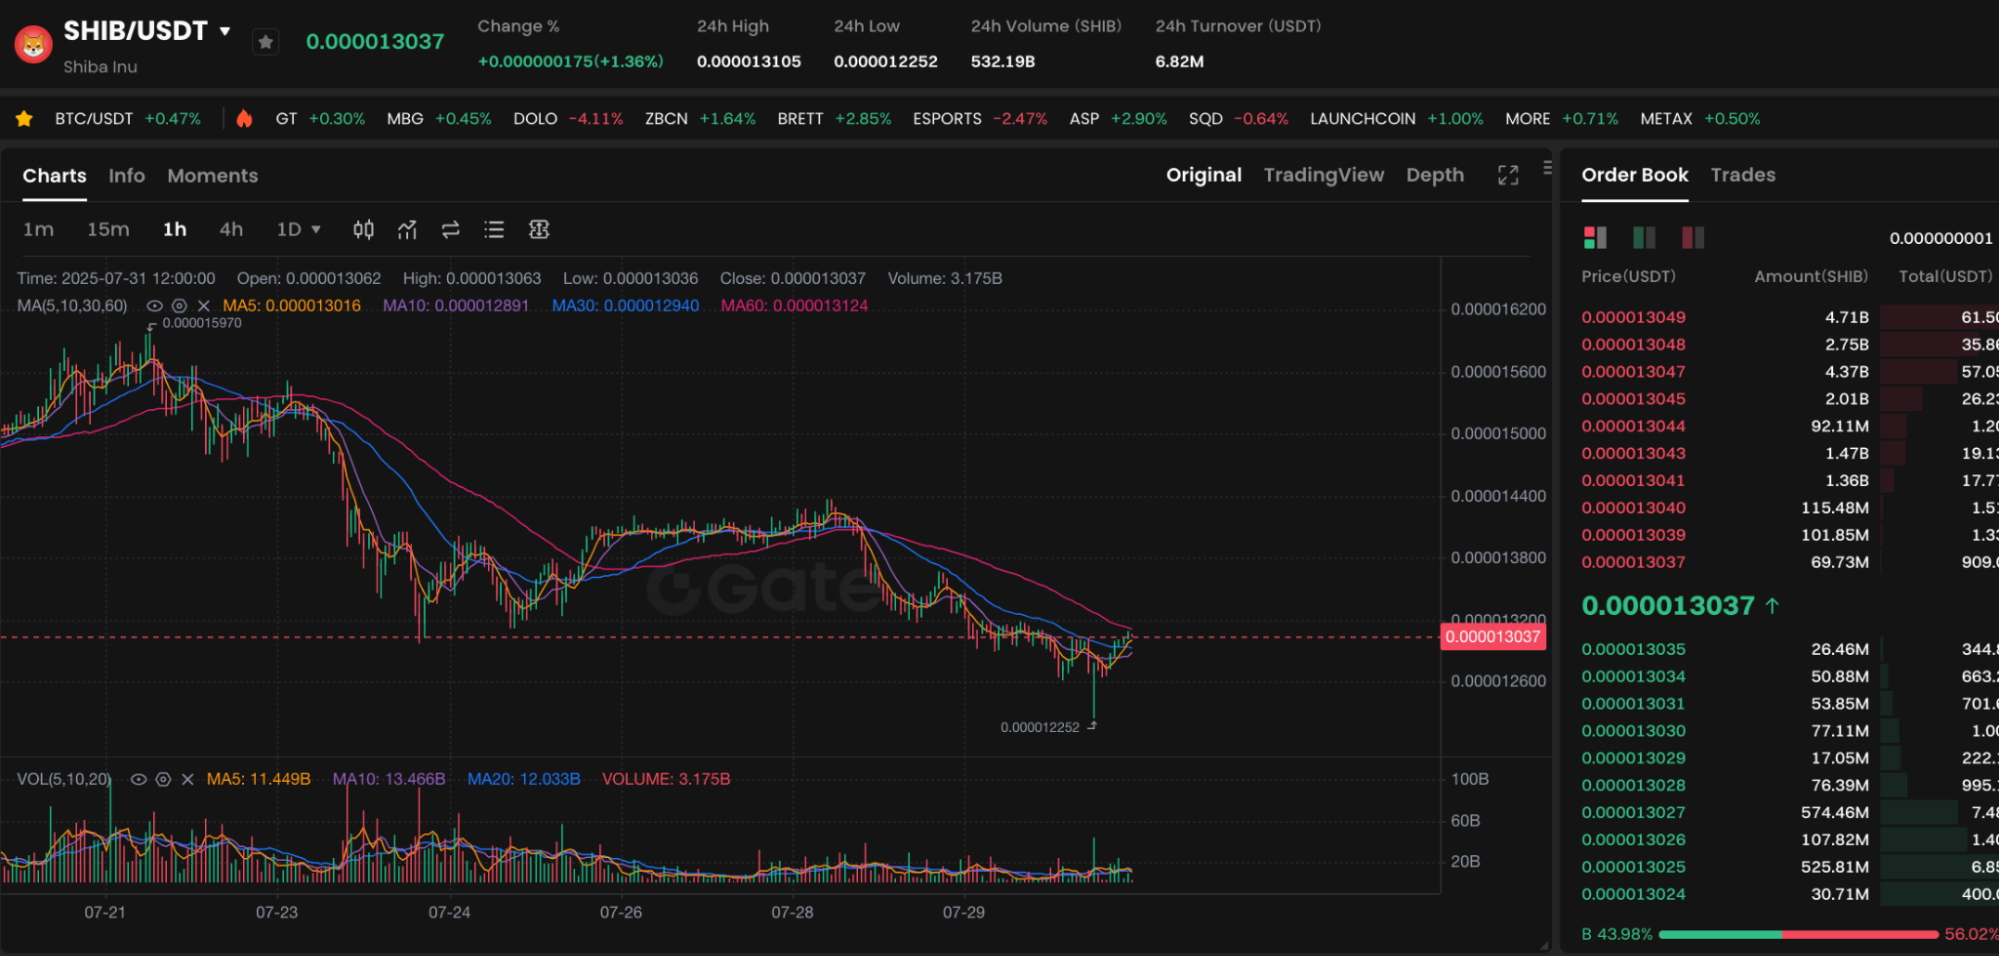
Chart: https://www.gate.com/trade/SHIB_USDT
As of July 31, 2025, Gate platform data shows that the latest SHIB/USDT price is $0.000013088, having pulled back slightly from the intraday high of $0.000013113. The 24-hour low touched $0.000012252, indicating significant short-term volatility.
During the most recent cycle, SHIB posted a robust rally in mid-July, peaking at $0.000015970. That move was followed by a high-level correction, with current prices retreating toward the lower bound of the recent consolidation range. While prices have fallen from their recent highs, they remain well above early July’s low of $0.00001108. This demonstrates that the broader uptrend is still intact.
Technical Trend Analysis
From a technical standpoint, SHIB is currently in a correction phase:
- Short-Term Moving Averages: MA5, MA10, and MA30 are all trending downward, reflecting continuing near-term weakness.
- Key Support Test: The price is currently fluctuating between MA10 ($0.000012997) and MA30 ($0.000012941). If SHIB can hold this zone and rebound, it may move toward the $0.000014 level again.
- MACD and KDJ indicators are near their bottom regions, suggesting a potential rebound.
Major players appear to be waiting on the sidelines as trading volumes have shrunk over the past few days. Watch for a potential pickup in volume to confirm the next move.
Capital Flows and Community Sentiment
On-chain data and sentiment tracking provide the following insights:
- Large buy orders cluster in the $0.00001300 - $0.00001280 range, indicating that whales or institutions are likely accumulating at these levels.
- Retail participation has decreased: Community activity on platforms like Telegram and Reddit is down about 20% since mid-July, reflecting a shift toward more cautious short-term sentiment.
- Search interest is declining, with hot topics like “Shiba Inu Breaks Multi-Month Price Milestone Amid 15% rally” coming off their peak popularity.
Despite the slight dip in community enthusiasm, the number of holders and total wallet addresses has not declined significantly, indicating that longer-term investors are not engaging in panic selling.
Risk Factors and Support Levels
The main risks and key areas to monitor include:
- Technical Support Test: $0.00001280 has been a critical support level over the past two weeks. A breakdown below this level could trigger a test of the $0.00001200 zone.
- Overall Market Risk Appetite Declining: Pullbacks in BTC or ETH could weigh on the meme coin sector.
- Lower Trading Activity: 24-hour volume stands at 71.346 billion SHIB, which is a clear reduction from the volumes observed during the uptrend.
If trading volumes remain lackluster, the market may enter a period of prolonged consolidation.
Outlook
Following a 15% rally, SHIB has entered a healthy correction, with short-term market sentiment becoming more rational. If the price stabilizes near $0.000013, there is still potential for another attempt at the previous high.
Trading strategies:
- Short-Term: Monitor support at $0.00001280. If SHIB falls below this level, avoid attempting to catch the bottom; instead, wait for clear signs of stabilization.
- Mid-Term: If the price reclaims and holds above $0.00001350, consider gradually increasing exposure, targeting $0.00001550.
- Risk Management: Always set stop-loss orders to limit losses during periods of high volatility.
Related articles

Pi Coin Transaction Guide: How to Transfer to Gate.io

What is N2: An AI-Driven Layer 2 Solution

Grok AI, GrokCoin & Grok: the Hype and Reality

How to Sell Pi Coin: A Beginner's Guide

Crypto Trends in 2025
