AzhuTongyu
AzhuTongyu
No content yet
- Reward
- 1
- Comment
- Share
- Reward
- like
- Comment
- Share
Some people have left 😂😂😂🤣🤣🤣 I don't want to waste time.
View Original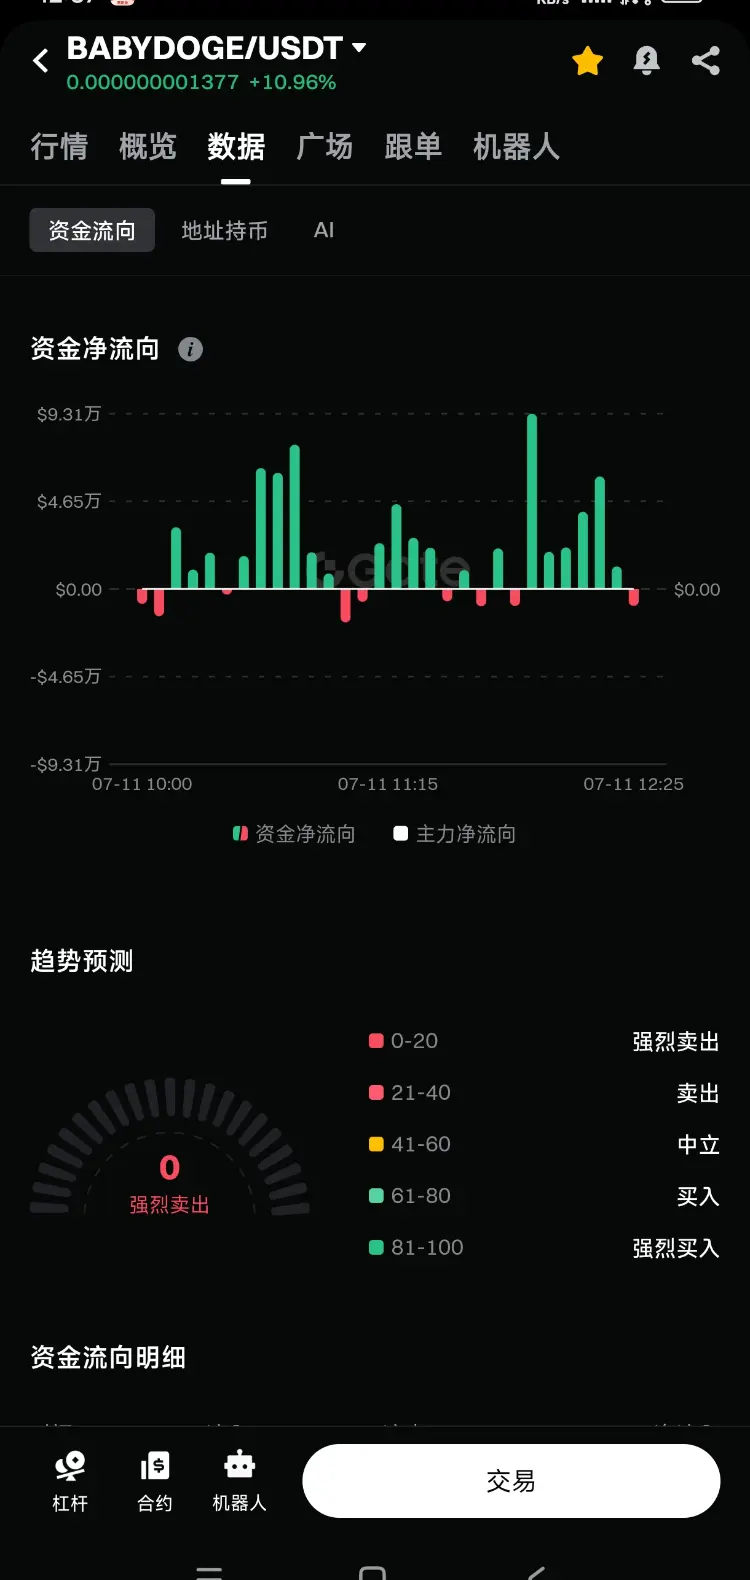
- Reward
- like
- Comment
- Share
Is this of reference significance?
View Original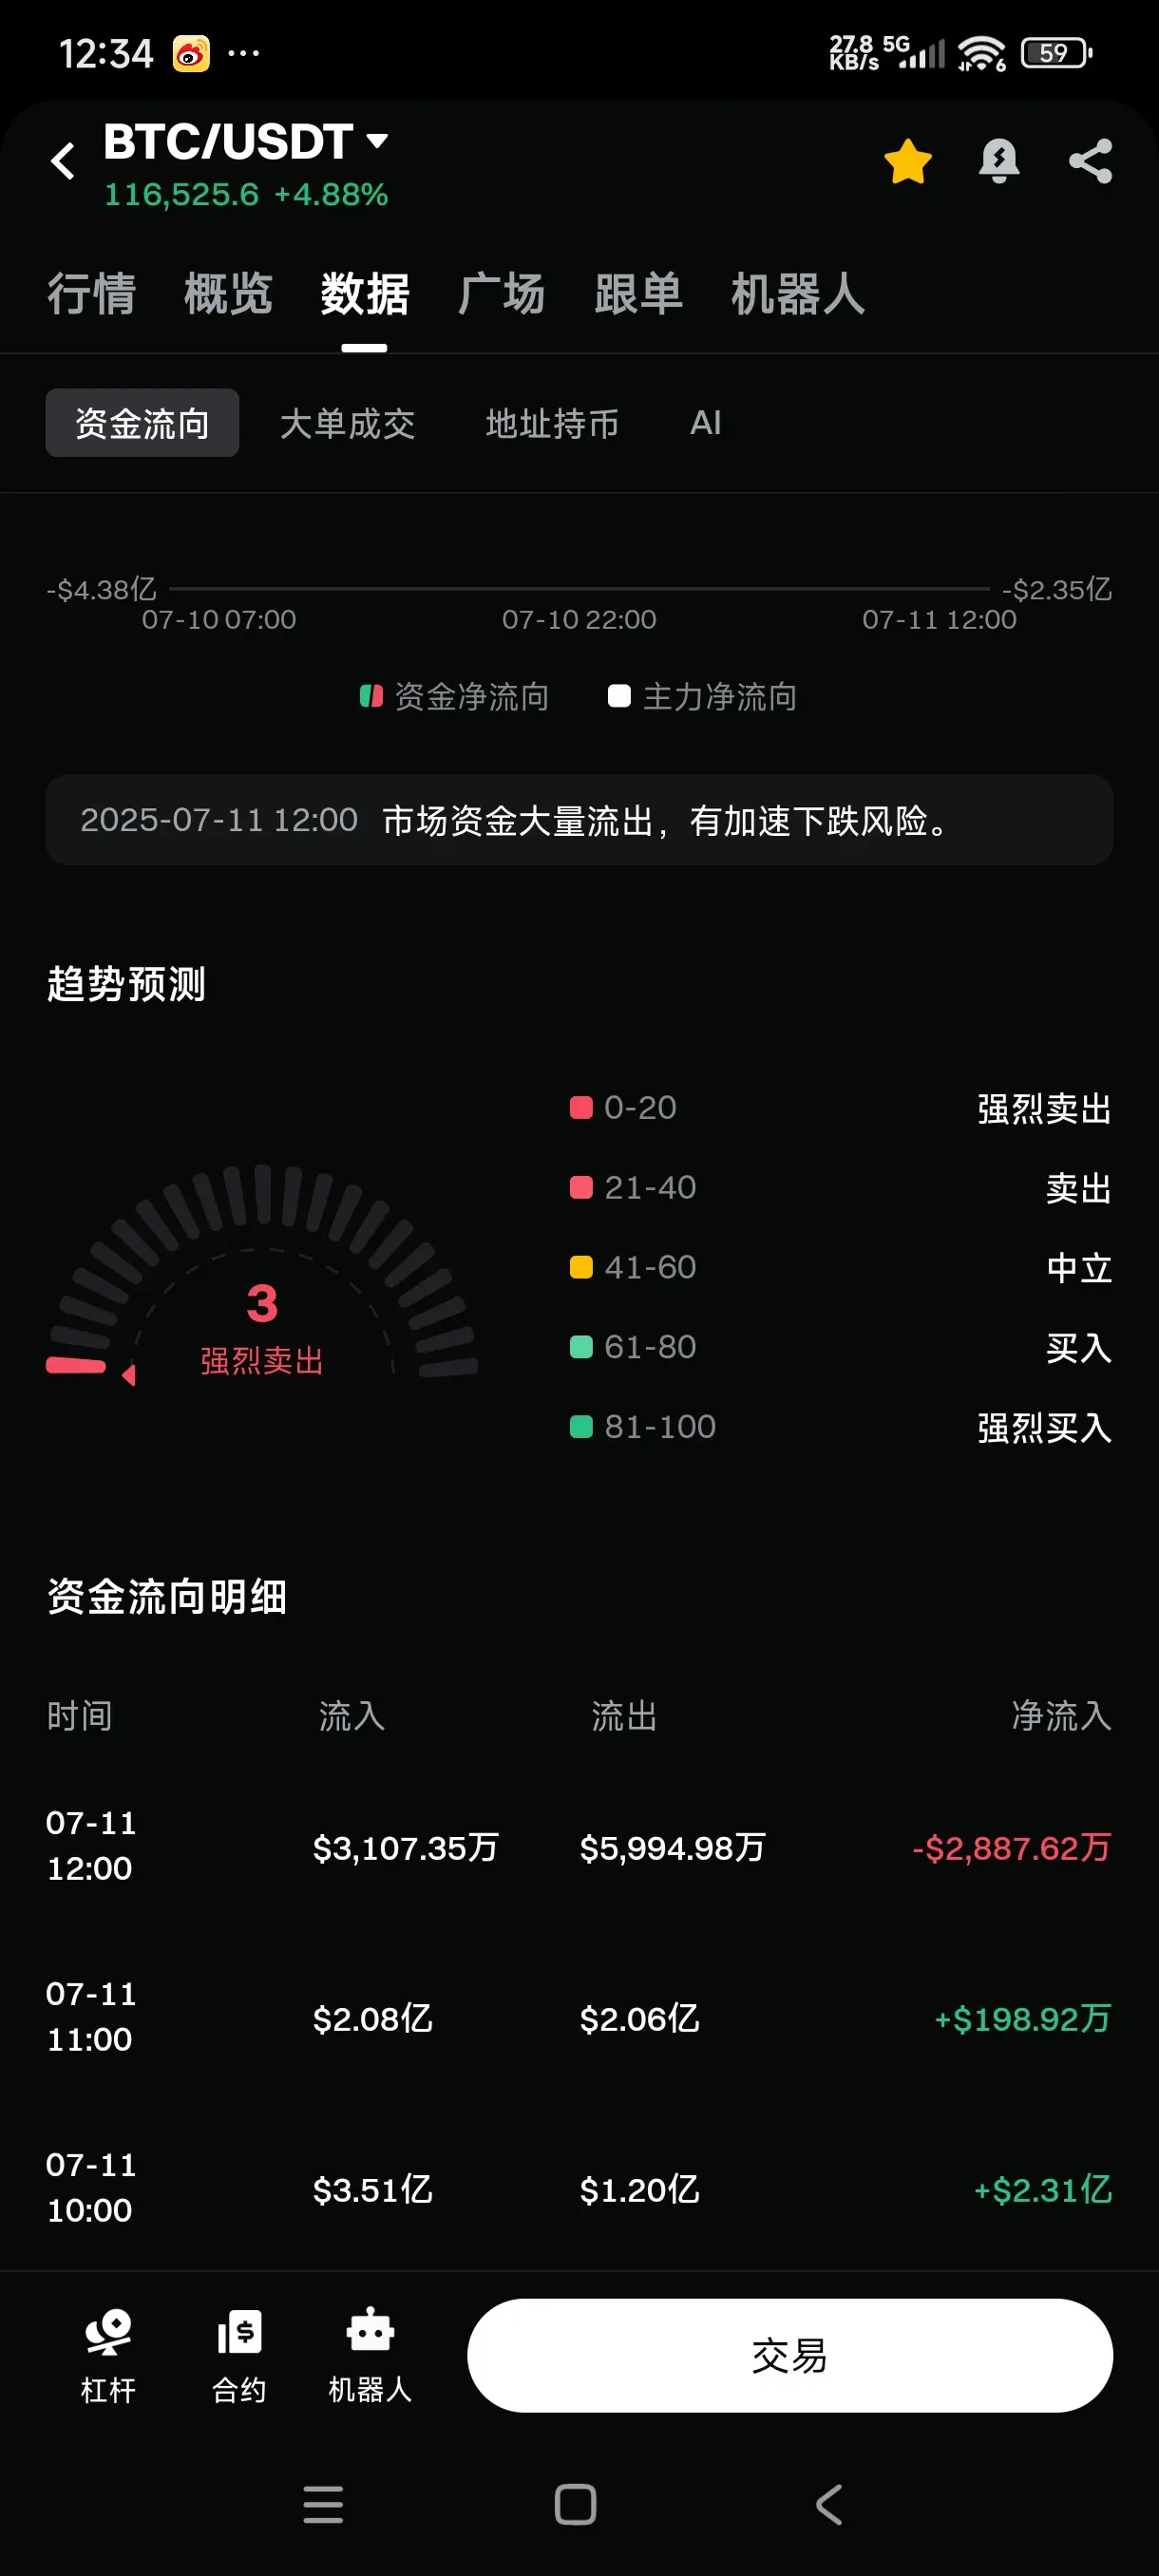
- Reward
- like
- Comment
- Share
Another 20 has been issued, it seems like something big is coming again. I wonder if the short order can withstand it.
View Original- Reward
- like
- Comment
- Share
#MBABYDOGE# nearly got liquidated halfway through, it was too brutal, last time I got pumped just by not paying attention.
View Original- Reward
- like
- Comment
- Share
Come and try it out, it's useful!
View Original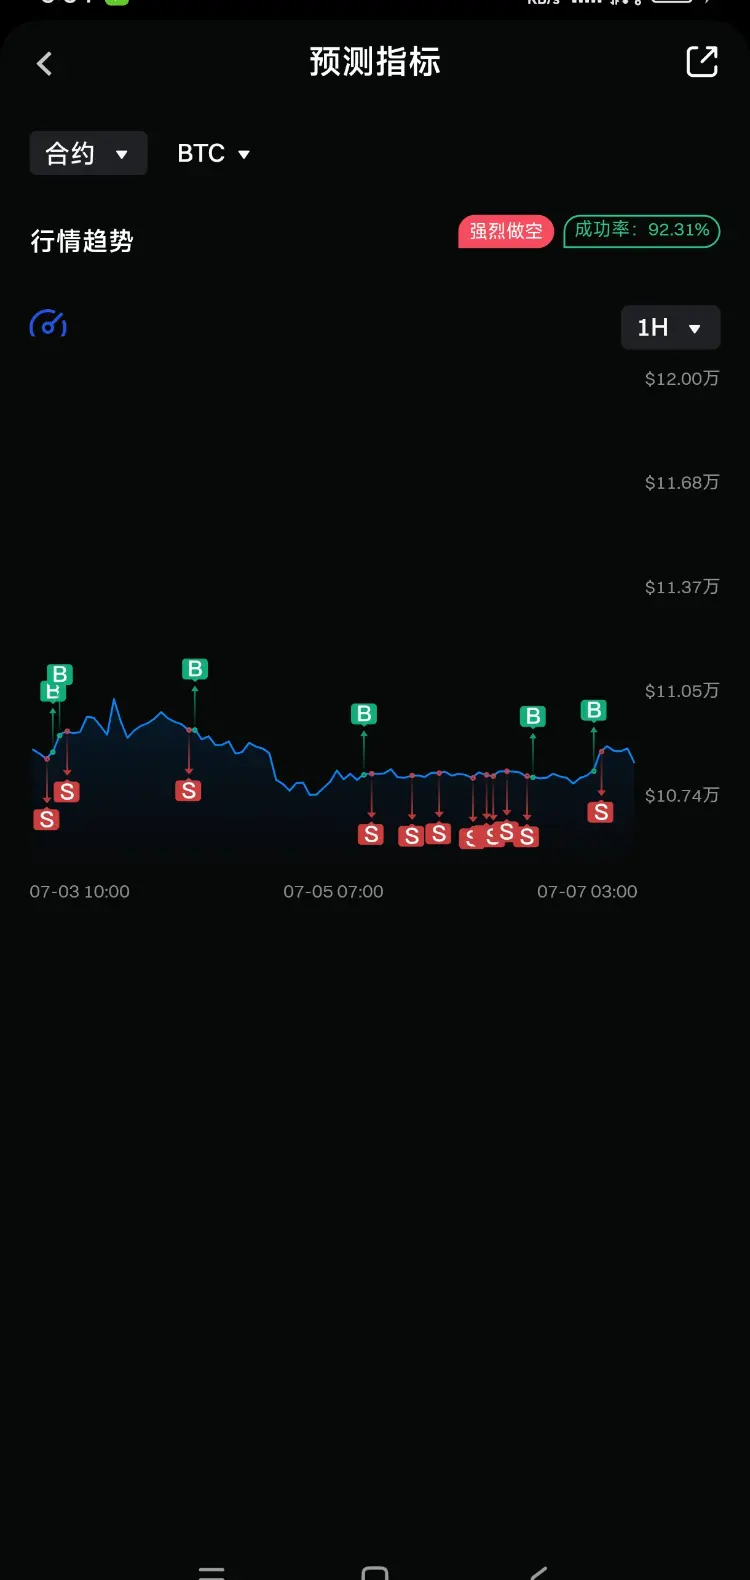
- Reward
- like
- Comment
- Share
- Reward
- like
- Comment
- Share

- Reward
- like
- Comment
- Share
Is there any way to avoid difficulties when playing with altcoins? Last year was as crazy with listings as this year is with catching up on homework.
View Original
- Reward
- like
- 1
- Share
AzhuTongyu:
Last year's madness is this year's subtle decline [捂脸] the trap has long been set.The following is an analysis of key levels for Bitcoin contracts based on the latest market dynamics and trading strategies, integrating technical analysis, on-chain data, capital flow, and the impact of macro events in July, to help you seize short-term fluctuation opportunities:
---
### 📉 **1. Key Level Analysis**
1. **Core Support Area**
- **$106,000-$107,200**: A strong support zone tested multiple times in June, coinciding with the 20/50-day moving averages ($106,144/$104,162). If breached, it may trigger long stop-losses, looking down to $104,000.
- **$103,000-$104,000**: Mid-term
View Original---
### 📉 **1. Key Level Analysis**
1. **Core Support Area**
- **$106,000-$107,200**: A strong support zone tested multiple times in June, coinciding with the 20/50-day moving averages ($106,144/$104,162). If breached, it may trigger long stop-losses, looking down to $104,000.
- **$103,000-$104,000**: Mid-term
- Reward
- like
- Comment
- Share
#MBABYDOGE# really fucking pumped my short order again.
View Original- Reward
- like
- Comment
- Share
#MBABYDOGE# Each estimated disaster comes a day early, what's wrong
View Original- Reward
- 1
- Comment
- Share

- Reward
- like
- Comment
- Share
It got cleaned up again, if you were a bit slow, it got cleared.
View Original- Reward
- like
- Comment
- Share
long order is not guaranteed
View Original
- Reward
- like
- Comment
- Share

- Reward
- like
- Comment
- Share
There is still a ten-day storm to come, so please be blessed
View Original
- Reward
- like
- Comment
- Share

- Reward
- like
- Comment
- Share